A shared reference
Locate the opening-range high, low, midpoint and available extensions around current price.
OR TELEMETRY / OPENING RANGE CONTEXT
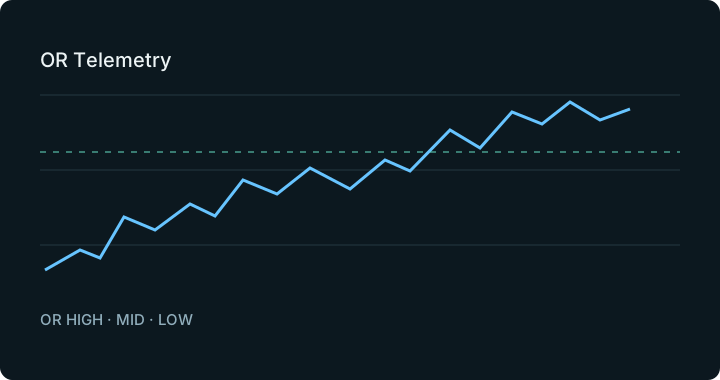
Follow price relative to the opening-range ladder. OR Telemetry combines the nearby reference, current pressure context and the hold or fail path above the main chart.
$0 today. Then $149/month unless canceled before your trial ends.
WHAT IT BRINGS TO YOUR SCREEN
Locate the opening-range high, low, midpoint and available extensions around current price.
Read the current level state separately from the directional pressure and route text.
A hold, failure or move through the level can change which reference matters next.
A SIMPLE SESSION ROUTINE
Keep your own trading process. Add a clearer view of the observations around it.
Controls, readings and examples in the manual →Select your market and check timestamps, contract coverage and missing-data messages.
Locate the opening-range high, low, midpoint and available extensions around current price.
Compare the reference with actual price behavior. Recheck the reading as new observations arrive.
BEFORE YOU OPEN IT
No. This page explains the tool. Open the member app for the current observations and their timestamps.
No. A reference describes the available evidence. It does not establish a win probability, a fill or the next price move.
Treat the missing reading as unknown. Check the selected market, contract and source status before interpreting it.
MAKE IT PART OF YOUR NEXT SESSION
Explore the tools with a 15-day free trial of 01DTE.
$0 today. Then $149/month unless canceled
before your 15-day trial ends.