THE BUILDER’S CASE FOR $149 A MONTH
Why you need 01DTE
Why we would pay for the workspace we built.
$0 today. Then $149/month unless canceled before the 15-day trial ends.
We would pay for a clearer view of the trade we’re considering.
If we were choosing a workspace for an active NQ or SPX trading routine, we would pay $149 a month for 01DTE. We built it around questions that come up while price is moving: where the short move sits in the larger swing, what has traded around it, and which options levels are nearby.
Those questions are worth answering before an entry. A rising candle can look convincing until you see the descending trend above it. A large selling number can look decisive until you notice that price has barely moved. We want those observations available together while there is still a decision to make.
We would expect the price, time window and data status to be clear too. A reading needs those details if we are going to use it to assess a trade.
The pressure we wanted to see stretched across the ladder.
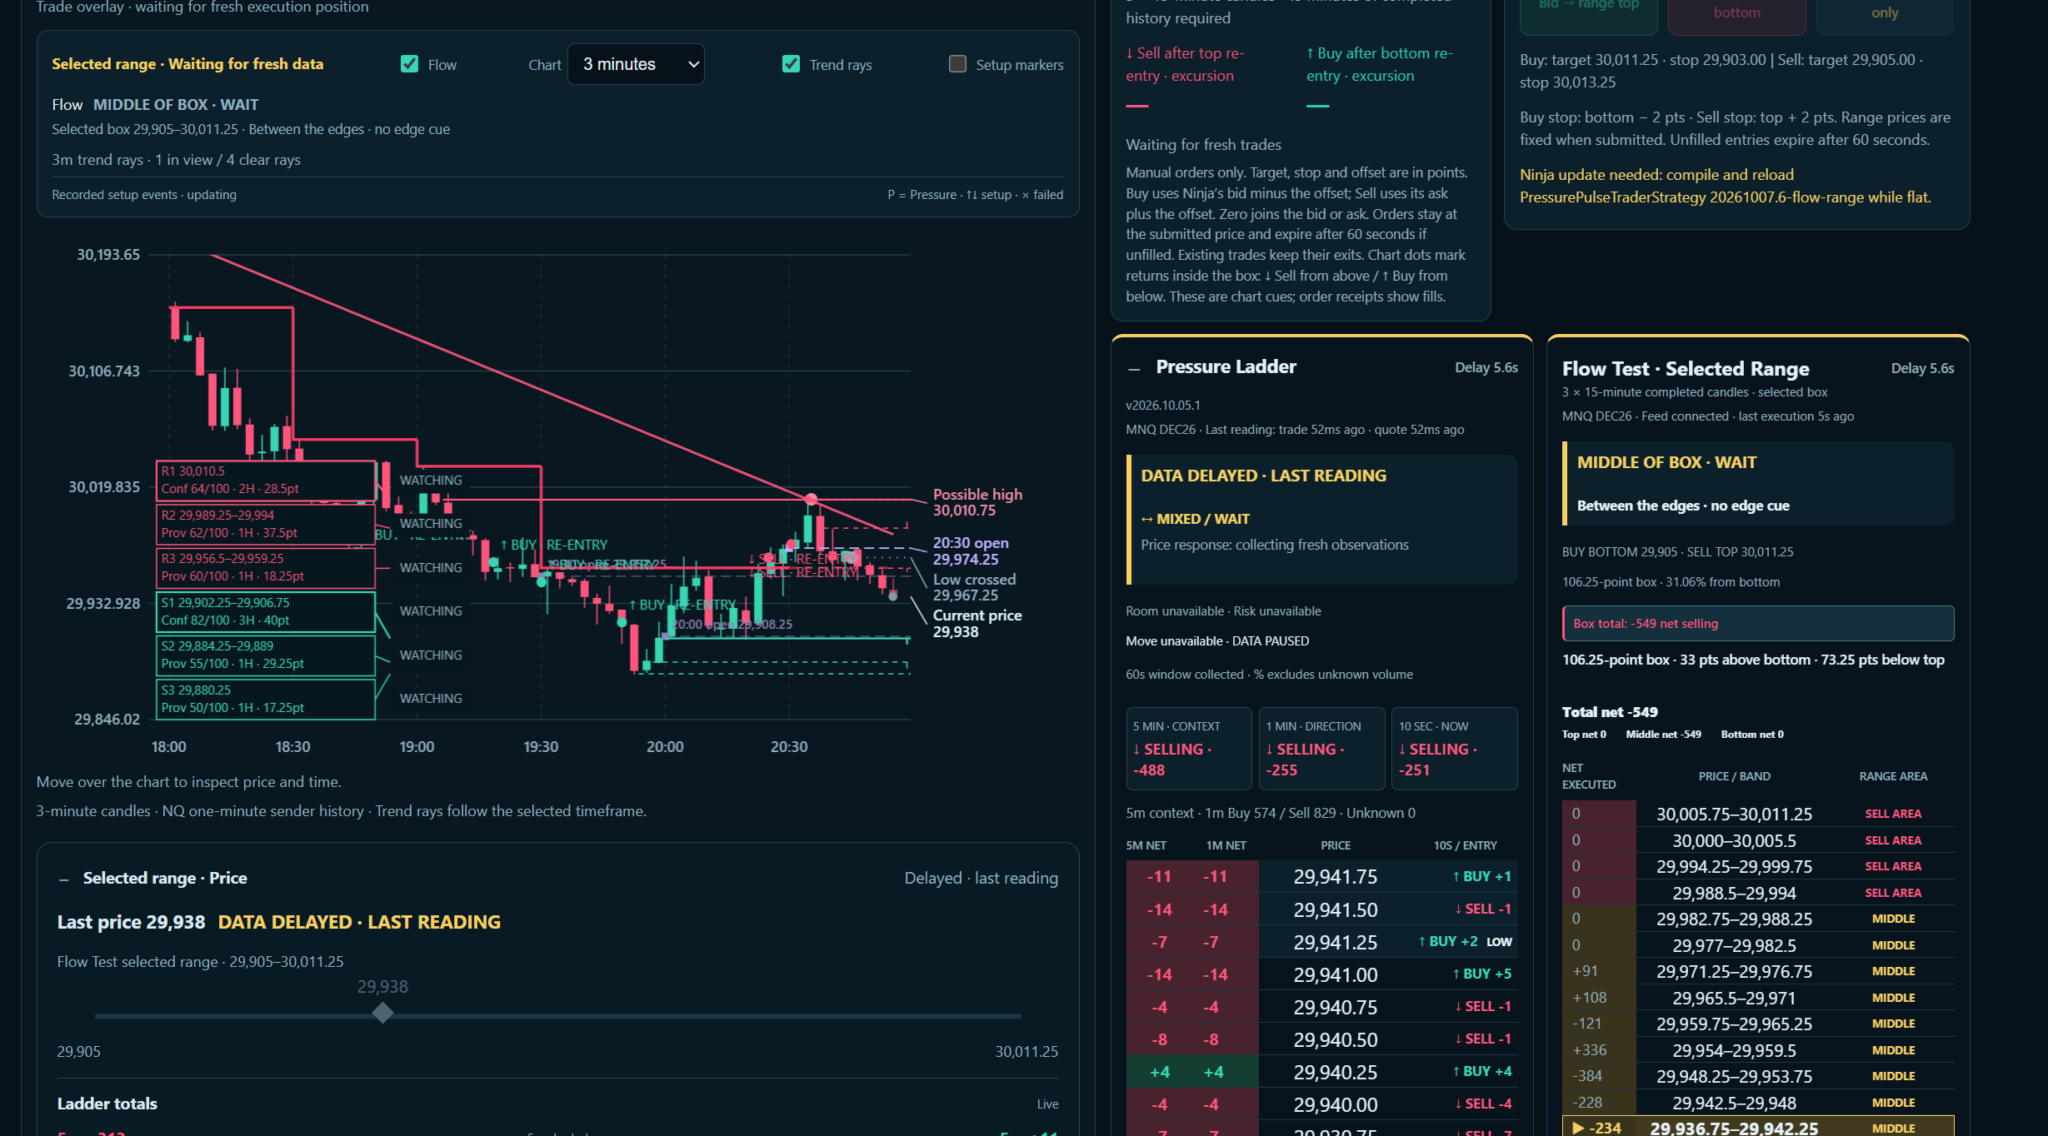
During development, we wanted to add up the red rows and the green rows and watch the balance change. Reading the current price alone left too much of the ladder out of the picture.
That led to the condensed ladder totals. The green side adds the positive row nets; the red side adds the negative ones. You can compare the one-minute reading with five-minute context and see whether recent activity is changing the pressure across the displayed prices.
Beside the chart, those totals let you see whether selling is spread across prices and how much ground price is giving up. The same net selling can accompany a decline or a market that holds.
Our price-response example keeps the contract totals fixed while you compare those outcomes. Compare the two price paths before judging the selling number on its own.
A short rally deserves a look at the larger swing.
The multi-timeframe trend analysis is one of the strongest reasons we would keep 01DTE open. You choose the swing high and low, and the analysis follows that structure through the four-hour, one-hour, 30-minute, 15-minute and three-minute charts.
That gives the latest rally a reference. You can inspect it as part of the same swing instead of changing your starting points every time you change the chart interval. Red rays descend from highs and green rays rise from lows; both can be present.
Fresh prices and candles update the view during the session. Watch price approach a ray, pull away or trade through it. Developing lines can change, and you can keep the larger structure in view while that happens.
A trade count becomes more useful when you know where it began.
We also wanted to count executed trades below a red trend ray and above a green one. Then we wanted the starting time, the first execution price, and the distance from the line. Without those references, a growing total was harder to interpret.
The tracker now puts bought, sold and net contracts beside those starting details. A separate gauge shows price movement from the first qualifying execution. If net selling grows while price rises, both observations stay visible.
The tracker connects the structure we chose with trading that happened around it. Contract totals describe executions; the gauge describes points. We can read the count without confusing it with how far price moved.
HalfTrend trade tracking starts a fresh count when the line changes price level or color. That gives the active line a starting reference of its own.
The trend-ray tracker accumulates from its tracking start. The ladder’s one-minute and five-minute windows answer a different question about recent pressure. Having both gives you a way to follow a move while still checking what has changed lately.
Options data should give you something you can locate on the chart.
Gamma Force ranks options concentrations and places the levels around price. That gives you a manageable place to begin: inspect a nearby concentration, open the call and put detail, then watch what price does as it approaches.
We would pay for the connection between the strike data and the chart. You can follow the price response at a level while keeping track of why that level drew your attention. A concentration can still be traded through; it is a reference to investigate.
For SPX, the dedicated GEX view adds an estimated net gamma reading and a modeled gamma flip for today’s SPXW expiration. The distance readout puts the flip in relation to SPX. You can see whether price is approaching it and recheck the estimate as fresh data arrives.
An SPX trader may spend more time with SPX GEX than with the NQ tools. We would judge that view by how often we use it to examine an SPX setup, with the estimate and its update time in front of us.
The readings need to keep up with the session.
A chart snapshot captures one moment. The member views update from their market feeds, and your saved chart preferences and picked swing anchors belong to your account. You can come back to the setup you chose and continue following the market.
The data-status details matter to us too. Data ages are visible. Interrupted tracking is labeled. Some readings retain the last valid snapshot with its timestamp when fresh data is insufficient. Check those labels before treating a displayed number as current.
The $149 monthly membership includes Market Auction, Pressure Pulse, Gamma Force and SPX GEX. You can start with the tool that fits your market and use the others when they answer a relevant question. NQ and MNQ executions describe their own futures markets; the SPX view uses SPX options data.
Browser analysis and order entry also have different requirements. You can view the shared readings in the browser. Manual orders from Pressure Pulse require your own NinjaTrader connection, the member connector and execution approval. Live accounts require separate live approval.
We would make the $149 earn its place in our routine.
The strongest reason to keep paying is that you use the information. During the trial, choose a market and follow a few situations you would normally trade. For NQ, watch a move around a selected trend ray and compare the executions with price. For SPX, follow price against the gamma estimate and nearby concentrations.
Then ask what the workspace added. Did the larger trend change how you interpreted the short rally? Did the pressure count give you a clearer view of activity at your level? Did the SPX page make the flip and its data age easier to follow?
We would keep paying when the views we use answer those questions regularly. You do not have to use every tool to judge the membership; evaluate the ones that fit your market.
Use the trial with your own charts. After 15 days, you should have a specific reason to keep 01DTE open during your session.